Info
Rewind comparisons are only available on larger screens.
compare
Daily activities
170 activities in 2022
Daily activities
211 activities in 2015
Gear
Total hours spent per gear
Gear
Total hours spent per gear
Longest activity (h)
Vigonovo / Bassano del Grappa
Distance
126km
Elevation
228m
Time
5.3hrs
Longest activity (h)
Camminata

Distance
9.98km
Elevation
0m
Time
1.7hrs
Distance
Total distance per month
4 960
km
Distance
Total distance per month
1 491
km
Moving time
Total moving time per month
245
hours
Moving time
Total moving time per month
192
hours
Elevation
Total elevation per month
7 820
m
Elevation
Total elevation per month
0
m
Moving time by sport
Total hours spent per sport type
245
hours
Moving time by sport
Total hours spent per sport type
192
hours
Streaks
Longest streaks
6
days
25
weeks
12
months
Longest streak 07-05-2022 - 12-05-2022
Streaks
Longest streaks
14
days
50
weeks
12
months
Longest streak 03-09-2015 - 16-09-2015
Rest days
Rest days vs. active days
42
%
Rest days
Rest days vs. active days
57
%
Start times
Activity start times
Start times
Activity start times
Activity count
Number of activities per month
170
activities
Activity count
Number of activities per month
211
activities
Carbon saved
Reduced carbon emission by commuting
30
kg CO₂
30.24
kg CO₂
451
PET bottles produced
151 214
Google searches
Carbon saved
Reduced carbon emission by commuting
0
kg CO₂
0.00
kg CO₂
0
PET bottles produced
0
Google searches
Group activities
You weren't alone out there
3
activities
2%
of your activities
3
With others
167
On your own
Group activities
You weren't alone out there
0
activities
0%
of your activities
0
With others
211
On your own
Calories burnt
Energy burned across your activities
154 138
kcal
154 138
kcal
571
Pizza slices
1 468
Bananas
Calories burnt
Energy burned across your activities
118 047
kcal
118 047
kcal
437
Pizza slices
1 124
Bananas
Activity locations
Locations over the globe
No data available
Activity locations
Locations over the globe
No data available
Photo
Apr 30, 2022
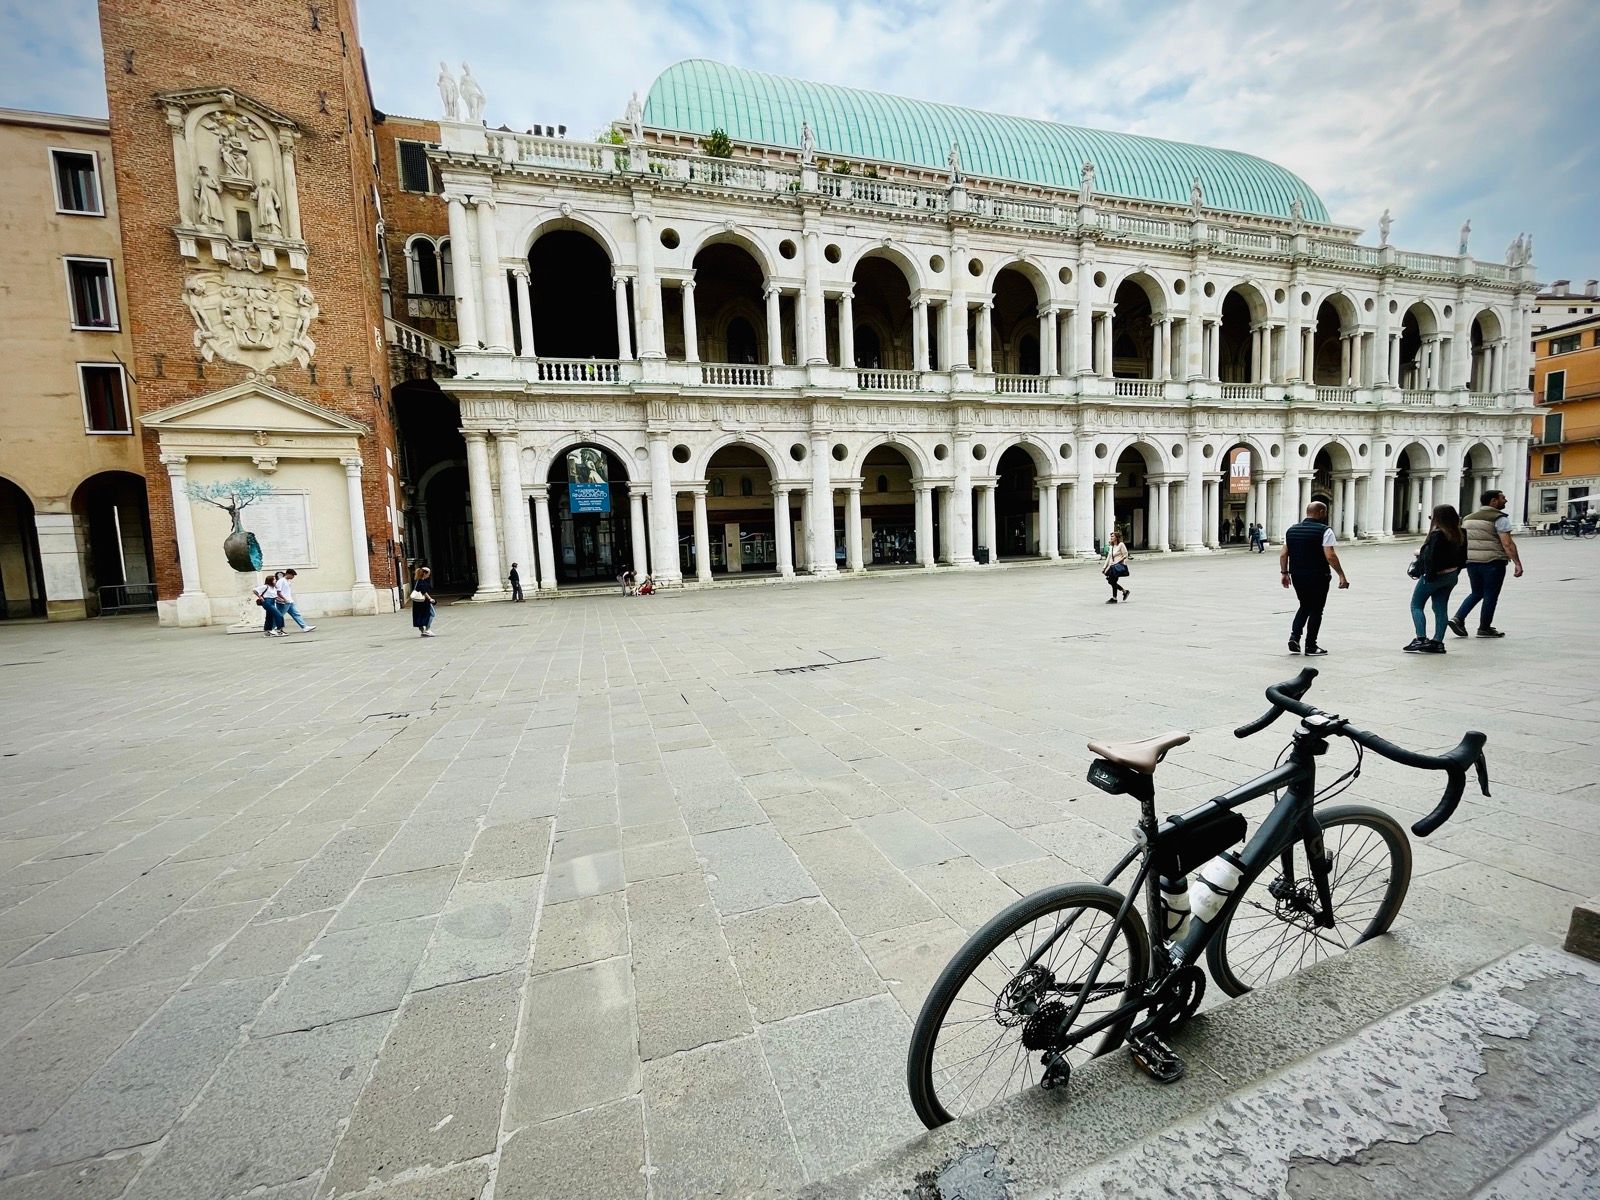
Photo
No data available
These charts are based on Kai's work, go check it out